
Learning how to read a quality inspection report is the single most powerful skill you can have to protect your investment, yet it’s often a source of anxiety.
You receive the email with the subject line, “Quality Inspection Report Attached.”
This should be a moment of relief, the final checkpoint before your products ship.
Instead, it’s a source of confusion.
You open the PDF and are immediately confronted with a complex document.
It’s filled with technical jargon, acronyms like “AQL,” and data charts you don’t understand.
You see a “Pass” at the top and are tempted to just trust it.
But a nagging fear remains: Are you missing something critical?
Are you about to approve a shipment with hidden problems that could damage your brand?
Don’t worry. This guide will transform that complex PDF from a source of confusion into your most valuable tool for confidence.
The Core of a QC Report: It’s Not a Scorecard, It’s a Map
The first mistake most buyers make is to view a QC report as a simple pass/fail scorecard. This is a trap.
The true value of a factory inspection report is not in the one-word summary; it’s in the data.
A “Pass” result might still contain warnings about minor defect trends that you need to address with your supplier before the next production run.
Conversely, a “Fail” result doesn’t automatically mean you should reject the entire shipment.
Perhaps the failure is due to a high number of minor cosmetic issues that don’t affect function, giving you a powerful data point to negotiate a discount.
Think of your inspection report as a detailed map of your production run.
It shows you precisely what was checked, what was found, and the overall quality level.
This guide will teach you how to read that map.
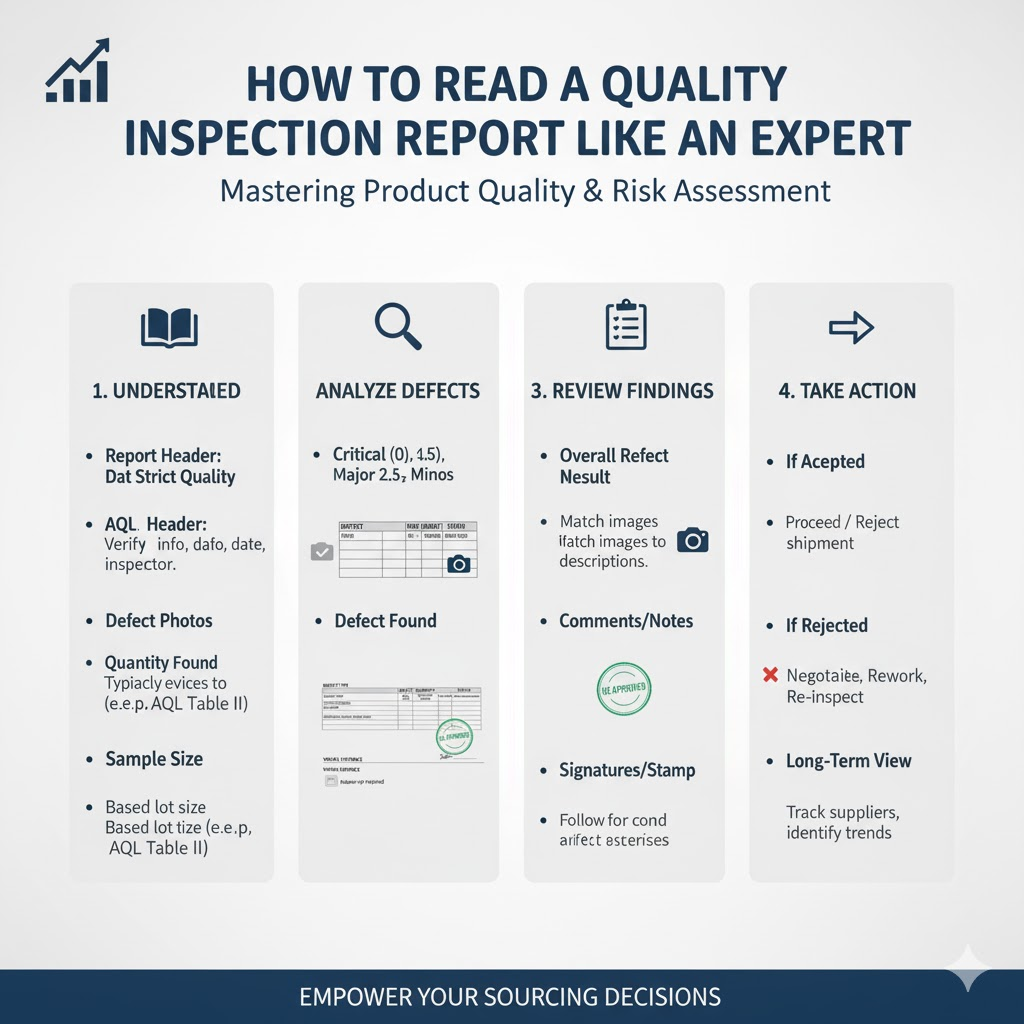
How to Read a Quality Inspection Report: A 5-Part Breakdown
A professional report is designed to be systematic.
While formats vary, they all follow a logical flow built on the same industry standards.
We will walk through the five key sections you must understand.
1. Overall Result: Pass / Fail / Pending
This is the top-line summary, but the “Pending” option is the most important one to understand.
Pass: This means the inspector completed the checks, and the number of defects found was within the acceptable limits you agreed upon.
Fail: This means the number of defects exceeded the agreed-upon limits, or the product failed a critical on-site test (like a safety or function test).
Pending: This is the expert’s insight. “Pending” is not a “Fail.”
It means the inspector found an issue that wasn’t covered in your specifications.
For example, the product color is slightly different from the photo, or a logo is 2mm off-center, but no tolerance was given.
The inspector is “pending” the report to ask you, the buyer, to make the decision.
A “Pending” result is often a sign of a good, thorough inspector.
They are not making assumptions; they are empowering you with data to make the final call.
2. AQL Standards and Understanding AQL
This is the most technical, and most important, concept in your report.
Understanding AQL is the key to understanding your quality agreement.
The Acceptable Quality Limit (AQL) is the “worst tolerable process average”.
In simple terms, it’s the pre-negotiated agreement between you and your supplier about the maximum percentage of defects that will be considered acceptable for a batch.
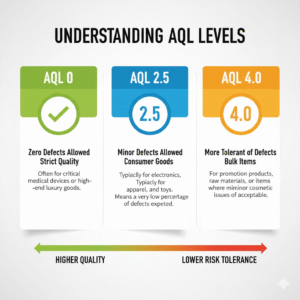
You typically set three AQL levels for consumer goods :
Critical Defects (AQL 0%): These are defects that are unsafe or could harm the user (e.g., a sharp glass edge). The tolerance is always zero.
Major Defects (AQL 2.5): These are defects that affect the product’s function, usability, or appearance, and would likely cause a customer to return it (e.g., a leaking glass). AQL 2.5 is the most common industry standard.
Minor Defects (AQL 4.0): These are small, cosmetic issues that don’t affect function and most users wouldn’t notice (e.g., a tiny internal air bubble). AQL 4.0 is a common standard for these.
These AQL standards are part of an international statistical system (ISO 2859-1 / ANSI/ASQ Z1.4).
For a more technical deep dive, the American Society for Quality (ASQ) is the definitive source for this standard.
3. Sample Size
You may see your report has a “Lot Size” of 5,000 units but a “Sample Size” of 200.
It’s natural to ask, “Why didn’t you check every single unit?”
Inspecting 100% of products is not only 5-10 times more expensive and time-consuming , it can also be less accurate.
-
Destructive Tests: Some tests, like a thermal shock test for glassware or a carton drop test, destroy the product. You cannot test 100% of your items this way.
-
Inspector Fatigue: A person checking 5,000 individual items will become fatigued. Studies and experience show that a fatigued inspector is more likely to miss defects than one performing a focused, statistical inspection on a smaller, randomized sample.1
The sample size isn’t chosen at random.
It is scientifically determined by the AQL tables based on your total “Lot Size” (order quantity) and the “Inspection Level” (usually “G-II” for consumer goods).
This ensures the result is statistically valid and representative of the entire batch.
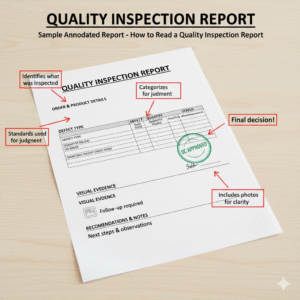
4. The Defect List (Your Pre-Shipment Inspection Checklist Core)
This is the heart of the report—the “map” of the problems.
It’s the core of any pre-shipment inspection checklist. Here, every defect found in the sample is photographed, described, and classified as Critical, Major, or Minor.
Here is the simple-terms difference:
-
Critical Defects: A defect that is unsafe or violates regulations.
-
Example: A sharp, unpolished point on the rim of a drinking glass.
-
-
Major Defects: A defect that affects the product’s function or makes it unsellable. The customer would almost certainly return it.
-
Example: The glass leaks, or a logo is severely scratched.
-
-
Minor Defects: A small imperfection that doesn’t affect function or safety. Most users would not notice it.
-
Example: A tiny, enclosed air bubble, or a micro-scratch on the bottom of the base.
-
5. On-Site Tests & Measurements
This section provides the objective evidence that backs up the defect list.
This is the raw data from the inspector’s work.
It proves your products were physically tested against your specifications. Look for:
Dimensional Checks: A table showing the specified dimensions (e.g., “Height: 100mm +/- 2mm”) next to the actual measurements taken from the sample units.
Functional & Assembly Tests: These check if the product works.
For glassware, this would include a Water Leakage Test (filling the item to check for leaks) or an Assembly Test (ensuring a lid fits perfectly).
Special Tests: This can include a Tape Test (applying tape to a logo to see if it peels) or a Stability Test (placing the item on a flat surface to check for wobbling).
Packaging Tests: A crucial test is the Carton Drop Test.
The inspector drops a packed shipping carton from a specific height (based on weight) 10 times to simulate the stress of shipping.
The test fails if the outer carton is destroyed or if any products inside are damaged.
Beyond the Data: How a Transparent Factory Inspection Report Builds a True Partnership
Any factory can send you a “perfect” QC report by hiding problems or pressuring the inspector.
A true manufacturing partner is not afraid to show you the minor defects they found and corrected.
A report with a few “Minor” defects is actually a sign of an honest, transparent process.
A report that is always “too perfect” can be a red flag.
This transparent approach to how you read a quality inspection report is what separates a true partner from a simple supplier.
At Elfglass, we believe that an empowered, informed partner is the best partner.
This philosophy is the final, most important part of our comprehensive 3-Step Quality Control Process, which integrates checks at every stage.
It’s the only way to build long-term trust and avoid the 5 Red Flags that signal a high-risk supplier relationship.
Conclusion: You Are Now the Expert
Go back to that email in your inbox.
When you open that PDF report, you will no longer see a wall of confusing jargon.
You see a map.
You now know how to read the “Overall Result” and why “Pending” is an opportunity.
You understand the “AQL” as your quality contract and the “Sample Size” as a statistical necessity.
Most importantly, you can go straight to the “Defect List” and “On-Site Tests” to understand the real story of your production.
You are now empowered to ask intelligent questions, protect your investment, and make data-driven decisions that safeguard your brand’s quality and reputation.
Frequently Asked Questions (FAQ)
Q1: What does AQL 2.5 mean in a quality inspection report?
A: AQL 2.5 is the most common quality standard for “Major Defects” in consumer goods.
It does not mean you are “allowing 2.5% defects.”
It is a statistical limit used in AQL sampling that determines the maximum number of defects allowed in a given sample size for the entire batch to “Pass” inspection.
Q2: What is the difference between a “Major Defect” and a “Minor Defect”?
A: A Major Defect is a flaw that affects the product’s function, usability, or saleability, making it likely a customer would return it (e.g., a leaking glass, a broken zipper).
A Minor Defect is a small cosmetic issue that does not affect function, and most users would not notice it (e.g., a tiny air bubble, a single loose thread).
Q3: If my quality inspection report shows “Fail,” should I always reject the shipment?
A: No. A “Fail” result is a data point, not a command.
You should never automatically reject a shipment without first analyzing the reason for the failure.
If it failed for a critical safety issue, you should reject it. But if it failed due to a high number of minor cosmetic defects, you have options.
The “Fail” report is a powerful tool to start a data-driven negotiation with your supplier for a rework, a re-inspection, or a discount.